Summary
As a data enthusiast, I finally gained the chance to be the master of Calzona’s data, for which I acted as a data analyzer as well as a data generator. Specifically, I created a data visualization project to envision Calzona’s weather and humidity as well as established Calzona Attraction, a photobooth project intending to promote this desert area.
Calzona Weather Visualization
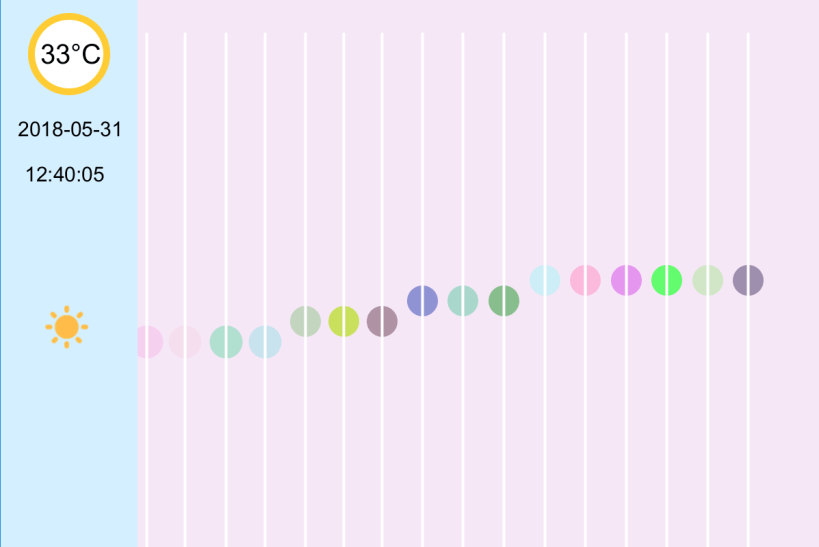
Future Calzona visitors! Wanna gain a straightforward sense of weather conditions before leaving for Calzona? The “Calzona Weather Visualization V.1.0” consists of various weather data (time, temperature, humidity, sunrise, sunset, etc.) from May 29, 2018 to June 4, 2018. Several notes to consider when viewing this project:
Y Position: Temperature measured every 10 minutes in Celsius degrees.
Radius: Humidity measured every 10 minutes in percentage.
Sun/Moon Icon: The time of sunrise and sunset.
This is the version with normal speed.
This is the faster version. More Straightforward!
The “Calzona Weather Visualization V 2.0” is being developed, so stay tuned for the new version with more surprising features.
Calzona Attractions
Welcome to Calzona Attractions! Here you can have the once-in-a-lifetime chance to take photos with our unique frame “I AM HERE Calzona”. You will then receive a printed version of four photos in a grid photo-booth format, as well as the digital file. This will be an admirable souvenir to collect, as each photo comes with a distinctive Calzona Stamp to mark your footmark. You are more than welcome to be involved in creating new data and promote Calzona desert by sharing the pictures on social media.
On June 2018, 14 visitors were luckily selected and have tested this creative facility. We are currently collecting their feedback and are working hard to enhance the interactive experience.
We are excited to launch this program in July 2018.
